Leaflet.Js is an open-source, lightweight, mobile-friendly JavaScript library created by Vladimir Agafonkin. In which you can implement map content on different map tiles like google-maps, OpenStreetMap, Mapbox, Maptiler, and your custom tile layer also using lots of plugins available in leafletjs.Com and also develop our own plugin by publishing on their Github repository. We can implement it in vanilla JavaScript, and its framework like react, angular, and Vue.
Features of Leaflet.js :
1. It supports the WMS layer, Geojson layer, vector layer, tile layers, and also supports other types of layers using their supported plugin.
2. It supports creating markers on the map with its events. Also, create a custom marker as our choice using images or create an SVG marker.
3. Use different map tiles(like OpenStreetMap, Google Map, Mapbox, bing), and easy to change its tiles.
4. It supports clustering, declustering Mechanism. Also, add a heatmap on the map.
5. Add vector layers on the map like point, circle, polygon, polyline, SVG, canvas, circle marker, path and etc.
6. It supports creating custom control on maps, adding image overlays, video overlays on maps, animate marker showing tooltip.
7. Customizing all the map elements using javascript.
How To Use Leaflet.js:
For use Leaflet.js . It has to include Leaflet.js (CSS and Js) which is available on https://leafletjs.com/examples/quick-start so include a library.


In setView, It contains two parameter
LatLng(first is latitude, second is longitude). So Above Value shows the LatLng of New Delhi.Zoom level.
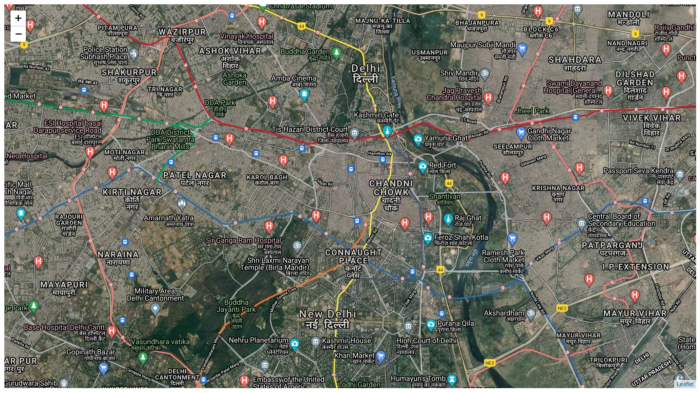
TileLayer contains the URL of the map-tile in which the Map is shown. and the parameter json block use for Setting its property.
Above Url Is For Open Street Map.
For Google Maps:-


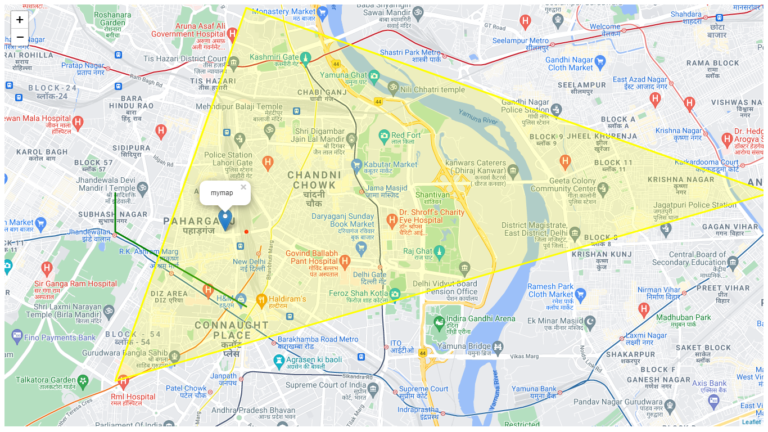
Adding markers and vector layer on the map.


Here is a basic overview of how to use a leaflet and its elements.it is pretty easy. just put elements and then add them to view.
Advantages:
- Lightweight. only weighting 39KB.
- Fast performance.
- Easy to implement.
- Open source and freely available.
- Easy to change map (as only the URL of tile layer should be changed).
- Powerful API, and plugins.
- Easy customization.
- Support on multiple js frameworks.
Disadvantages:
- The developer should be familiar with javascript.
- In some base layers, it should cost(like Mapbox).
- It needs to use GIS programming for setting up information.
- Customization takes more effort on elements sometimes.

